Melbourne in data: suburbs, footpaths and dining seats
A suburb map shaded by Census rent, income and age with the firms on our lists, hour by hour footfall on CBD footpaths, and the count of cafe and restaurant seats by precinct since 2002.
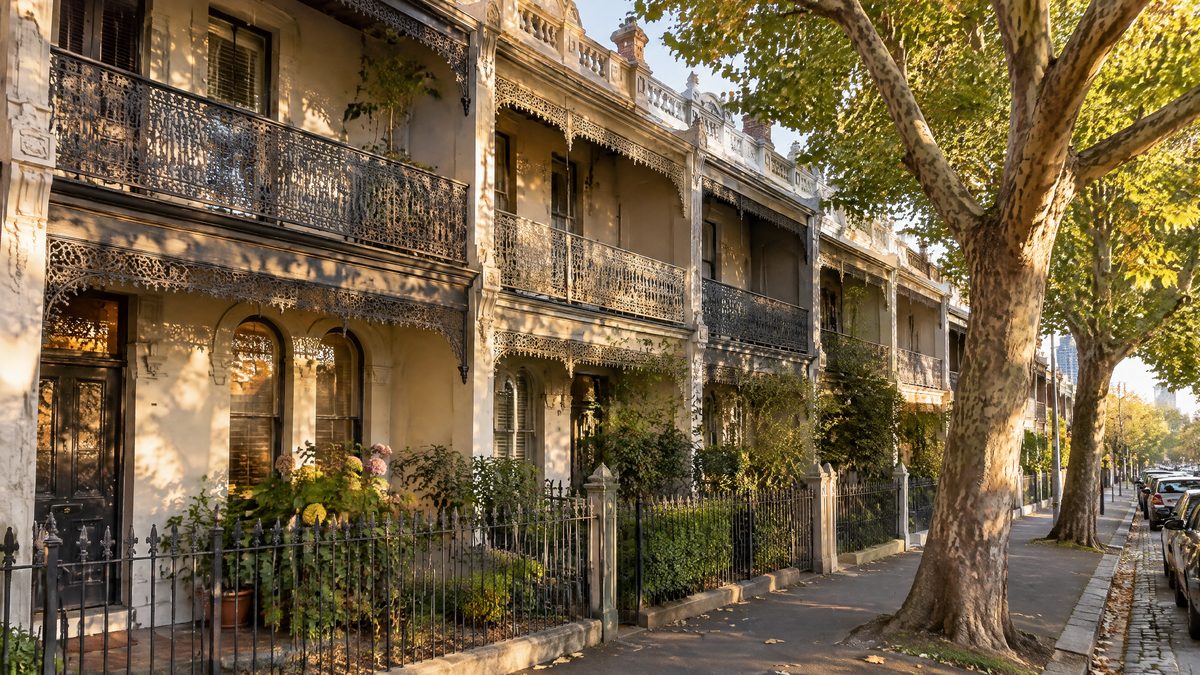
Melbourne Suburb Map: Rent, Income and Age in 572 Suburbs, With the Firms on Our Lists
Shade a map of Greater Melbourne by median rent, household income, age, share born overseas or the number of firms on our lists, then touch any of the 572 suburbs to see its 2021 Census figures and which firms keep an address there.
Updated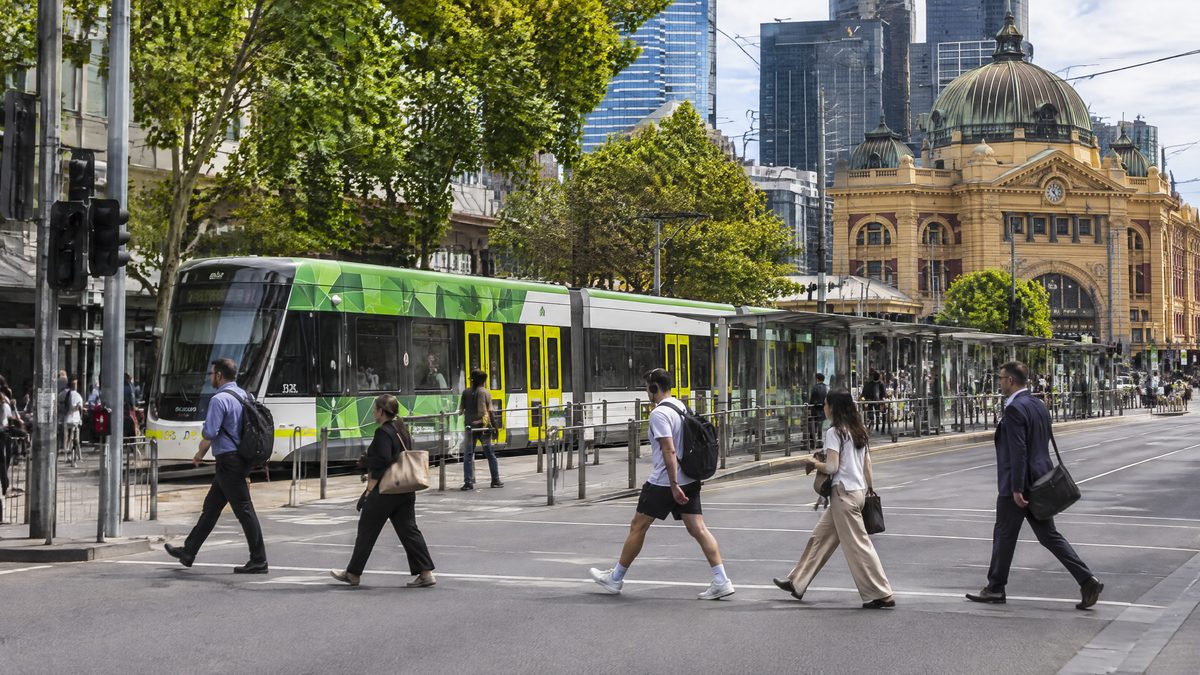
Melbourne CBD Footfall by Hour: When Each Street Is Busiest and Quietest
Pick one of 95 footpath sensors and a day of the week to see the average number of people passing hour by hour over the last year, then compare the busiest and calmest hours, the quiet months and the twelve busiest corners.
Updated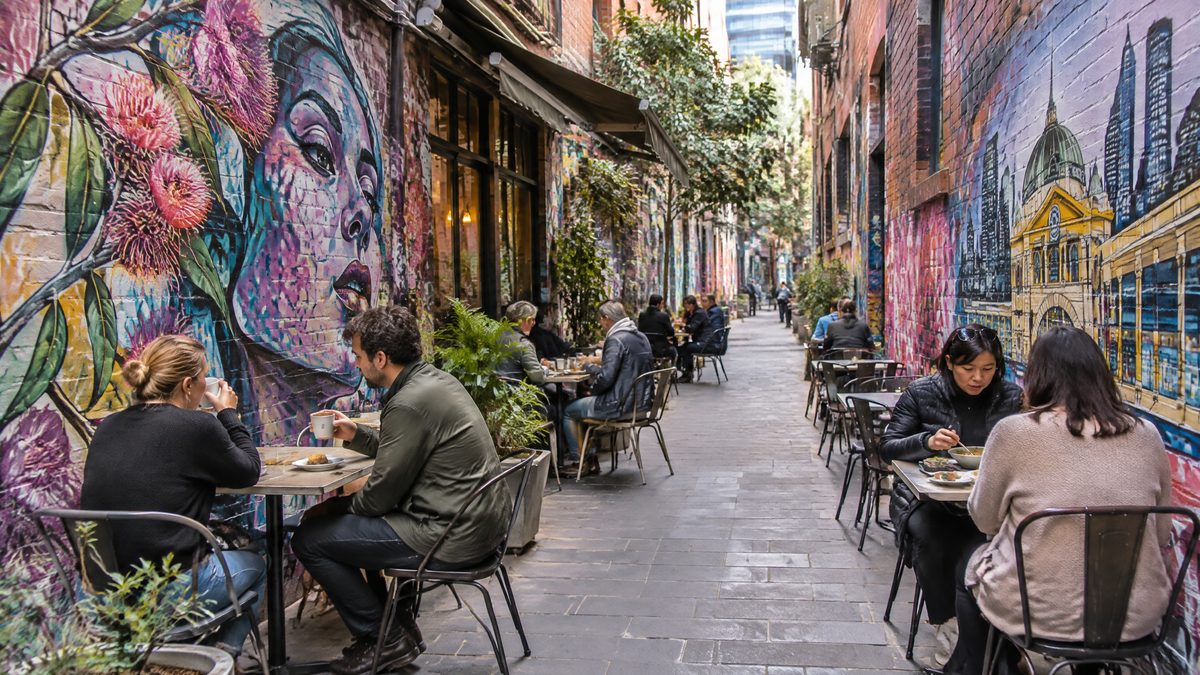
Melbourne Cafe and Restaurant Seats Since 2002: How Many, Where and How Many Outside
The City of Melbourne counted 181,372 dining seats in 2024. See the count year by year from 2002 for the CBD, Southbank, Docklands, Carlton and eight more precincts, split into indoor and outdoor seats, with the biggest venues in each.
Updated